Capacity Planning for Returns Warehouse Space Allocation
Returns need separate zones sized by category, not blended rates, to prevent reliability breakdowns.
Returns warehouses don't work like forward fulfillment centers, and treating them the same way is the single biggest planning mistake in reverse logistics. A returns operation has no known SKU list on any given morning, no reliable arrival schedule, and no resolved answer to where an item is even supposed to go once it's back on the shelf. Space planned around the assumptions of outbound fulfillment, predictable quantities, known condition, scheduled trucks, absorbs returns badly: docks back up, inspection has nowhere dedicated to happen, and unsorted stock drifts into pick locations meant for sellable inventory. That's not a minor inefficiency. At any real scale, it becomes a reliability problem that gets worse every peak season it goes unaddressed.
How much extra space returns require before you begin planning zones
Start with a number. Industry analysis puts the added space burden of reverse logistics at 15 to 20% over what a comparable forward fulfillment operation needs, since nobody knows how much volume is coming back or when. That range is a floor, not a target. Categories with long return windows, high fraud rates, or return-heavy product mixes push the real number well past 20%.
The cost of getting this wrong has gone up. Warehouse construction costs have climbed roughly 44% since 2021, so a facility that under-planned its returns zone in 2021 now faces a much more expensive fix than it would have a few years back. There's a cheaper first move, though: the average warehouse today runs at around 68% capacity utilization. A meaningful share of operations already have idle square footage that could be reallocated to returns before anyone signs off on new construction.
Sizing the returns zone by category, not by average return rate
A blended, facility-wide return rate is close to useless for space planning. Applying one number across every SKU leaves the zone oversized for categories that rarely come back and badly undersized for the ones that do.
The category spread is wide. Clothing carries the highest online return rate of any major category, with roughly one in four purchases sent back. Footwear follows close behind, landing around 17 to 19%. Accessories, food and beverage, electronics, and cosmetics all run meaningfully lower, and home and furniture is at the bottom of the range, the category least likely to generate a return.
The fix is arithmetic. For each major category, multiply expected sales volume by that category's actual return rate, then layer in a dwell-time factor based on how long that item type typically sits in the zone before it's graded and moved on. A seasonal apparel item carrying a long return window ties up space for far longer than an electronics accessory with a short return window, even if both sell in identical volumes. Skipping that granularity makes the forecast wrong before the first trailer arrives.
The zone layout that separates returned inventory from active stock
Returns need a physically separate, access-controlled area, full stop. An item that hasn't been graded yet cannot be allowed to drift back into active pick stock, because a mispriced or damaged unit that reaches a customer a second time turns a return cost into a trust problem.
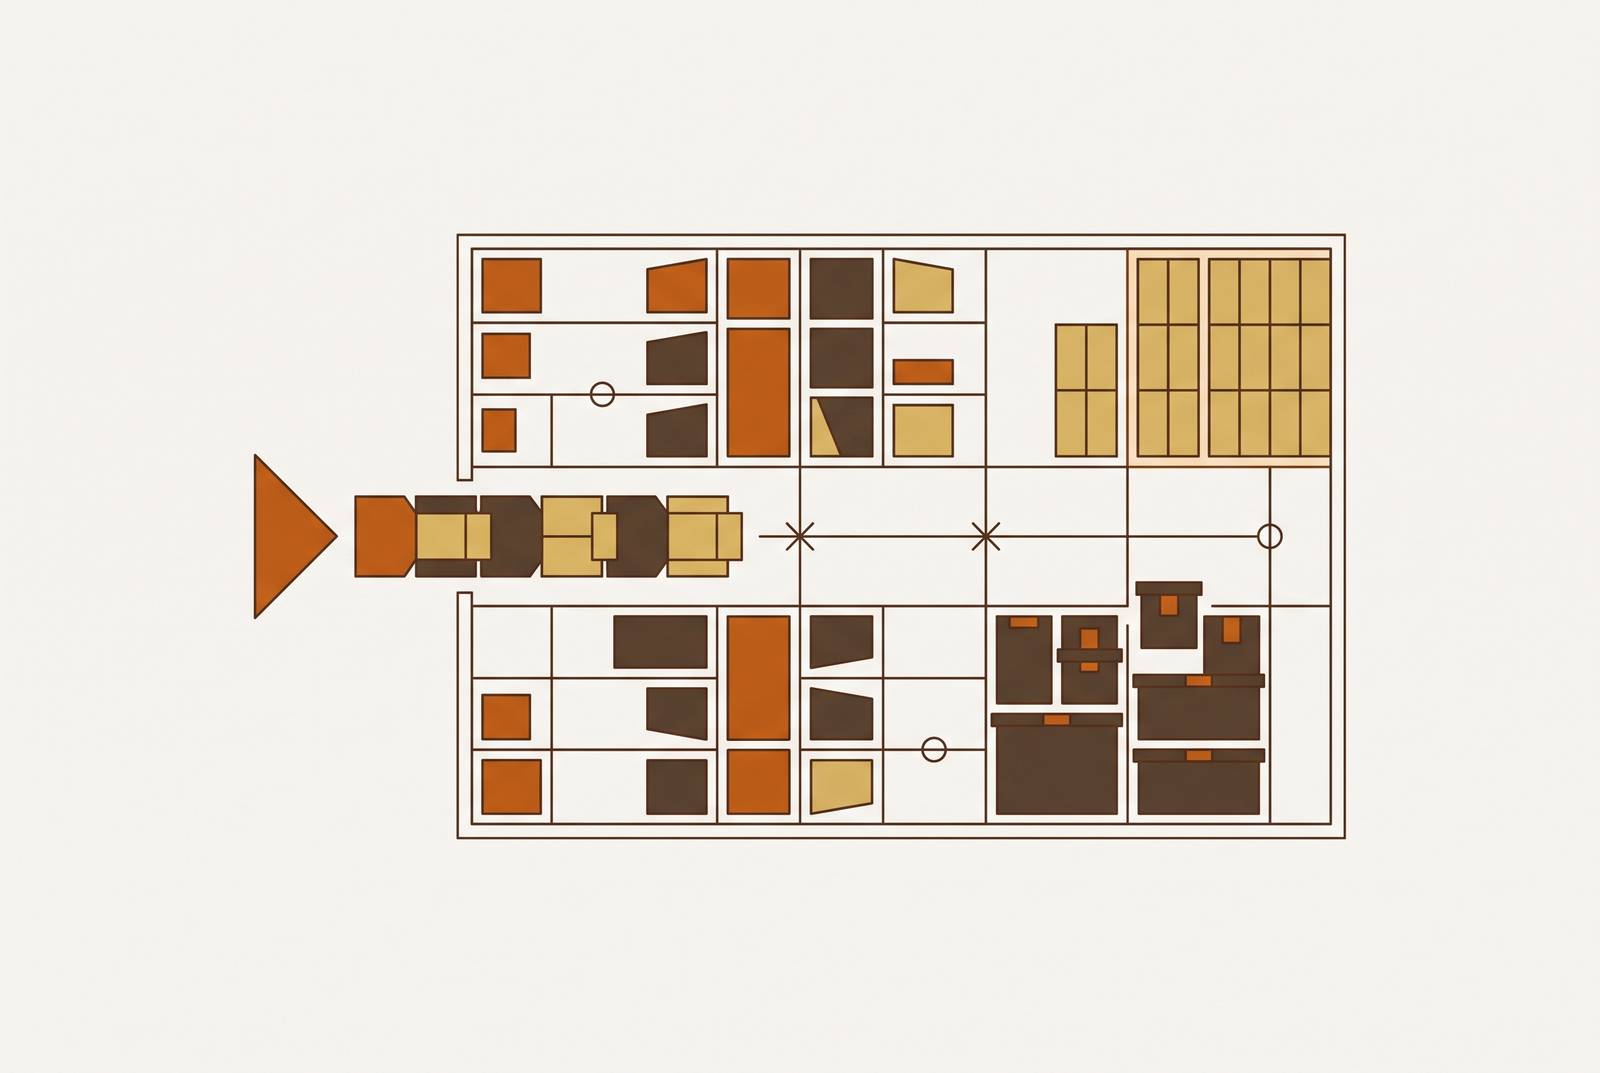
A working returns zone breaks into four sub-areas. Triage stations sit at the front: every item gets inspected and graded here first, and nothing moves deeper into the zone without that grade attached. A refurbishment area handles cleaning, repackaging, and light repair for anything that can go back to saleable condition, placed close to triage to cut travel distance but kept process-separate from it. Quarantine shelves hold items still under review, whether that's a quality hold or a fraud investigation, and access to that area should be restricted. Disposition staging closes the loop with four outbound lanes: restock, repair queue, liquidation, and disposal, each sized to the volume it actually carries rather than split evenly.
Smaller operations can run on a three-bin version, restock, discard, return to supplier, and that's the operational minimum. Anything more complex adds liquidation and donation lanes on top. Aisle width inside the returns zone is its own variable, separate from the main warehouse floor plan. Pickers and inspectors frequently work side by side in this area, and a narrow aisle here creates a bottleneck that backs pressure all the way up to the receiving dock.
Building the volume model that drives space allocation decisions
Returns deserve their own volume model. Folding return forecasts into a general inventory model as a single line item hides the category-level variation that makes returns hard to plan for.
The model needs five inputs: historical return rate by category (never blended), the share of purchases that were gifts (since gift returns cluster differently in timing), return window length by SKU or category, average dwell time, and the fraud or dispute rate, which adds directly to quarantine hold time and volume.
The calculation itself is straightforward once those inputs are in place: for a given period, zone space needed equals expected sales units multiplied by category return rate multiplied by average item cubic volume, divided by storage density, held for the average dwell time. Run that separately for each category block, then sum the results. Averaging across categories before running the math erases the exact variation the model exists to capture.
Planning for peak-season return surges without permanent overcapacity
Returns peak twice, not once. There's an early spike right before Christmas, driven by early-season purchases coming back ahead of the holiday, and then the larger surge is in the weeks right after New Year's.
The scale of that second spike is easy to underestimate. Post-holiday return rates for the weeks following December spike sharply for high-return categories, well above the annual average most operations teams budget against. Making it worse, most retailers extend return windows into late January for holiday purchases, which stretches the surge across weeks instead of compressing it into a few days. The zone has to hold elevated volume for an extended stretch, not absorb a short spike and reset.
Staffing timing compounds the problem. Roughly 43% of retailers bring on seasonal staff specifically to handle returns, but a lot of that seasonal labor rolls off before the January peak actually arrives, leaving the heaviest volume of the season to be handled by a thinner crew than the one that handled December.
Inbound visibility and dock scheduling as the upstream capacity control
A lot of returns bottlenecks start before the trailer ever reaches the dock. Without advance visibility into what's inbound, there's no way to allocate labor or dock space ahead of the volume, and everything downstream reacts instead of prepares.
Returns don't arrive with the lead time a purchase order gives a forward fulfillment operation. The dock design has to assume some amount of unscheduled volume is normal, but the scheduling system on top of it should work to shrink how often that happens: carriers book inbound time slots, warehouse teams get manifest data ahead of arrival, and labor plus zone space get assigned before the truck backs in, not after it's already unloading.
This is a space problem specifically: a dock that takes in returns in uncontrolled batches creates sudden demand spikes in the zone that the physical footprint, sized for average flow, simply cannot abso... It's a space problem specifically: a dock that takes in returns in uncontrolled batches creates sudden demand spikes in the zone that the physical footprint, sized for average flow, simply cannot absorb in the moment.
How technology compresses the space a given volume of returns requires
Dwell time is the lever that matters most. The longer an item sits in the returns zone before its disposition is decided, the more concurrent space it occupies. Cutting dwell time lets the same square footage handle a larger volume without adding a single pallet position.
Manual returns processing in a traditional distribution center typically stretches from receipt to final disposition over a period of weeks. AI-driven workflows compress that materially. Analysis of next-generation returns facilities found that AI-enabled sites process meaningfully more volume per square foot than conventional ones, a gain traced to automated sortation, shorter dwell time, and faster routing to disposition.
Disposition engines are a big part of that gain. Instead of a manual call at a desk, the engine routes each item by condition grade, category, and resale value automatically. Benchmarks for 2026 point to the majority of returns being routed to resale-ready status, with the decision itself dropping from a matter of minutes to a matter of seconds.
Maintaining and adjusting the space allocation over time
A returns space allocation set once is already wrong within a season or two. Category mix shifts, return rates move, and every new piece of automation changes throughput enough to make the old math stale.
Review it on a schedule instead of waiting for a problem to surface. Zone utilization, dwell time by category, and disposition backlog need weekly attention during peak periods and monthly attention the rest of the year.
Three signals say the allocation needs a change. Zone utilization sitting consistently above a 70 to 85% target band means the zone is undersized or throughput has slowed down somewhere in the process. Dwell time climbing across a category that used to clear quickly points to a bottleneck in grading or disposition rather than a space problem. And a disposition backlog that keeps growing instead of clearing each cycle means the outbound lanes, restock, repair, liquidation, disposal, are undersized relative to what's actually coming through triage. None of these appear on a quarterly report by themselves. They show up in the zone, on the floor, before anyone runs the numbers.